
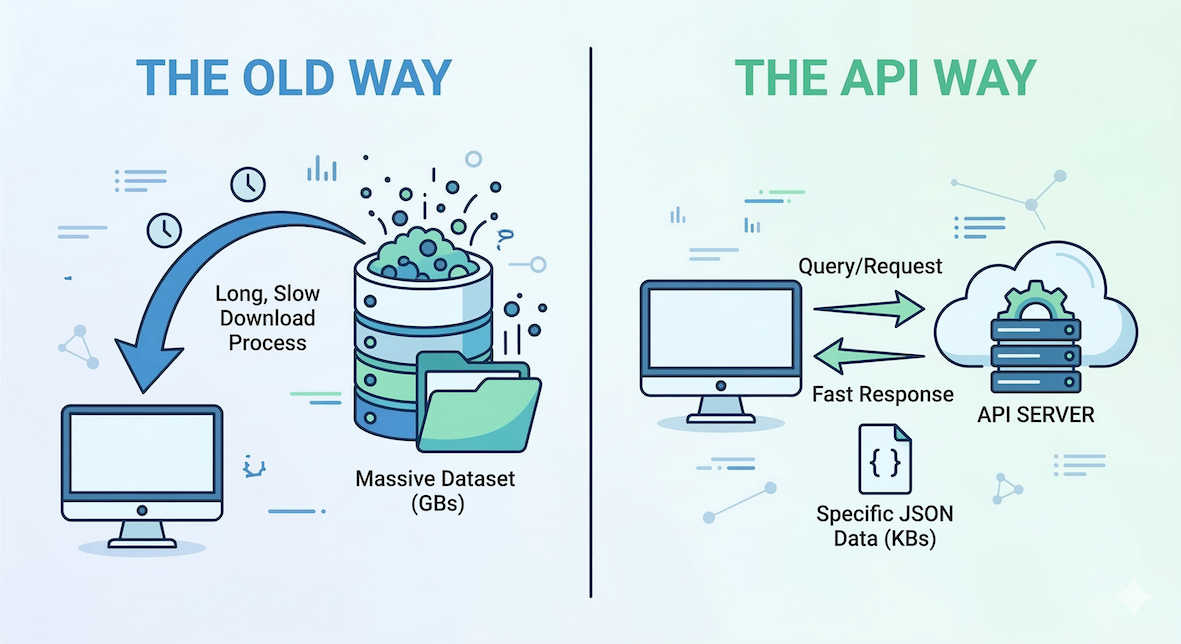
Conceptual diagram: Instead of downloading a massive dataset locally, your code uses an API to request only the specific data needed from a remote server, receiving a concise response.
So far, we have worked with tools and data running locally on your computer. But the true power of spatial data science unlocks when your code can talk to the rest of the world.
In this section, you will learn how to write Python code that fetches live information from external servers, such as real-time weather data, without ever opening a web browser.
1. Introduction to Web APIs
An API (Application Programming Interface) is essentially a set of rules that allows one program to talk to another program. Many modern websites, scientific institutions, and government agencies provide an API so that developers can query their databases in an automated way.
For spatial analysis, Web APIs are critical. They allow you to access massive computing resources without running heavy operations on your own machine. Common spatial use cases include:
Getting real-time weather data for specific coordinates.
Converting street addresses into coordinates (geocoding).
Getting driving directions and routing between places.
Downloading specific slices of massive satellite datasets.
Most spatial APIs use a standard called REST, meaning you interact with them over standard web protocols (HTTP), exactly like your web browser does when loading a page.
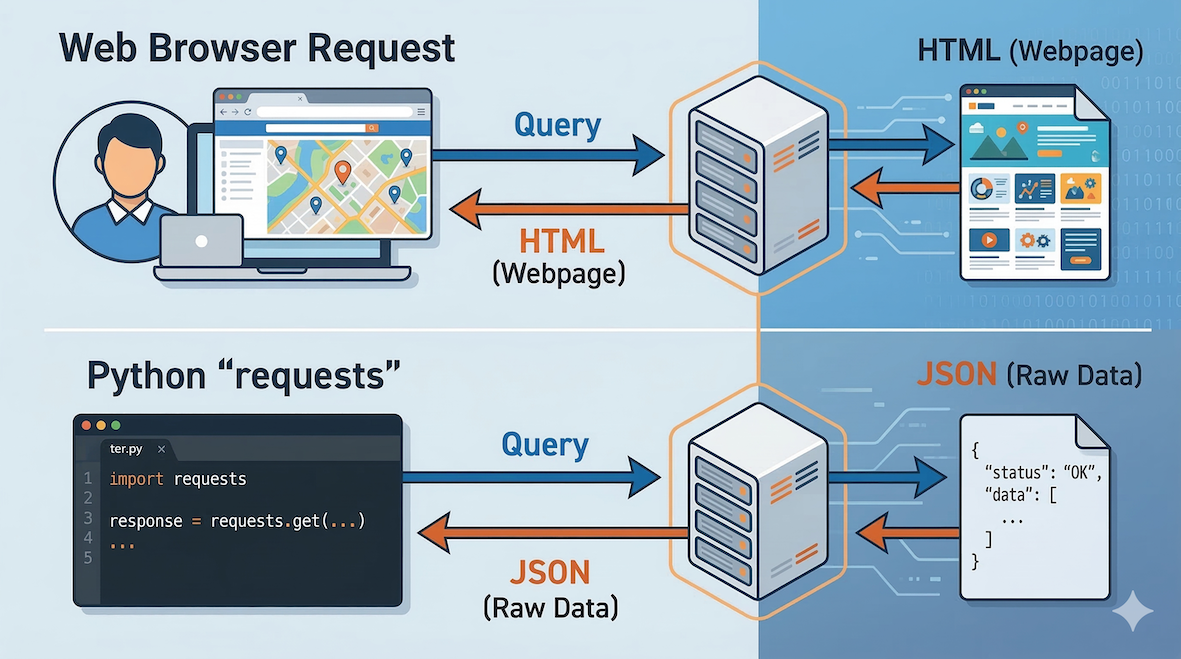
Analogy: Standard websites send visual HTML data to your browser, while APIs send structured raw data (like JSON) directly to your Python code.
2. The requests module
To query a server, your code needs to send a request over the internet and wait for a response. The community-built requests module is the absolute standard for doing this in Python.
When you send a request, the server sends back a response containing both the data and a status code. The status code tells you if your request was successful (Code 200 means “OK”).
import requests

# Ask a web server for its homepage
response = requests.get("https://objectiveunclear.com/airloom.html?airport=ZRH")

# Check if the request was successful
print(response.status_code)
Concept check
Imagine you write a script to download a dataset from a government API, but you accidentally misspell the URL: requests.get('https://api.weather.gov/spelled_wrong').
Will Python crash on this line? What will the status_code likely be?
Will it crash?
Python will not crash, but the status code will be 404 (Not Found).
The requests module successfully did its job: it sent a message to the server, and the server successfully replied with “I can’t find that page.”
Because Python itself doesn’t crash when a URL is wrong, it is entirely up to you as the programmer to write an if response.status_code == 200: check before trying to extract data. If you try to run .json() on a 404 error page, then your code will crash!
3. Understanding JSON
When an API sends data back to you, it almost always uses a format called JSON (JavaScript Object Notation). JSON is the universal language for data exchange on the web. Conveniently, it looks and behaves almost exactly like nested Python dictionaries and lists.
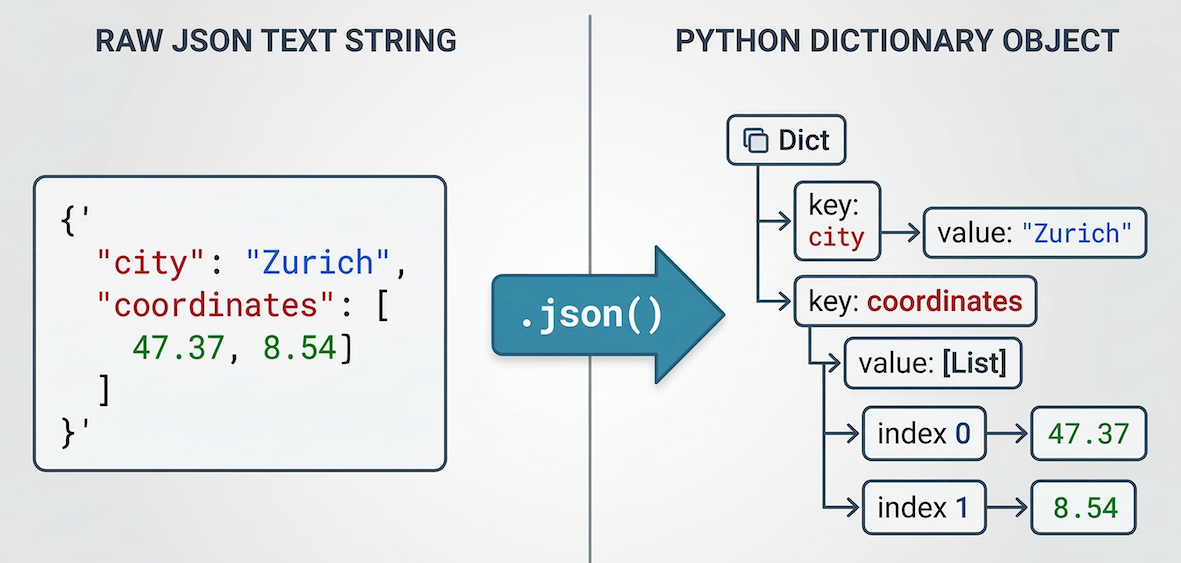
Visual representation of JSON data: The text format on the left is automatically parsed into a structured, hierarchical Python dictionary/list on the right, allowing easy data access using keys.
(Note: When dealing with vector shapes like polygons, APIs use a spatial flavor of this format called GeoJSON. We will explore GeoJSON later in the course.)
The requests module has a built-in .json() method that automatically converts the raw text response from the server directly into a Python dictionary that you can navigate.
# Assuming 'response' is a successful request holding JSON data
data = response.json()

# Access data using standard dictionary keys
print(data["temperature"])
4. Fetching live weather data (JSON)
Let us look at a real-world example using the Open-Meteo API. This is a free, open-source weather API that requires no authentication key, making it perfect for learning.
We want to find out the current temperature in Zurich. To do this, we need to pass the latitude and longitude of the city to the API. We do this by creating a parameters dictionary and handing it to the requests.get() function.
import requests

# 1. Define the API endpoint URL
api_url = "https://api.open-meteo.com/v1/forecast"

# 2. Define our query parameters (Zurich coordinates)
parameters = {"latitude": 47.37, "longitude": 8.54, "current_weather": "true"}

# 3. Send the GET request
response = requests.get(api_url, params=parameters)

# 4. Check the status and extract the data
if response.status_code == 200:
    print("Request successful!")

    # Convert the JSON response into a Python dictionary
    data = response.json()

    # Navigate the dictionary to find the temperature
    current_temp = data["current_weather"]["temperature"]

    print(f"The current temperature in Zurich is {current_temp}°C")
else:
    print("Request failed.")
    print("Reason:", response.text)
By changing the latitude and longitude in the parameters dictionary, you can instantly fetch the current weather for anywhere on Earth.
If you are curious, inspect the
data["current_weather"]dictionary to see which other weather parameters are included, likewindspeedandwinddirection.
Concept check
Assume you successfully pinged the Open-Meteo API and converted the response into a Python dictionary called data. The raw JSON structure looks like this:
{
  "latitude": 47.37,
  "longitude": 8.54,
  "current_weather": {
    "temperature": 15.2,
    "windspeed": 9.4,
    "winddirection": 270,
    "time": "2023-10-25T14:00"
  }
}
How would you extract the winddirection value (270) and save it to a variable?
Drill down the dictionary!
direction = data["current_weather"]["winddirection"]
Why?
You cannot just ask for data["winddirection"] because that key is hidden inside a nested dictionary. You must step through the hierarchy sequentially: first opening the "current_weather" dictionary, and then selecting the "winddirection" key inside it.
5. Fetching historical climate data (CSV)
In the previous example, the Open-Meteo API returned data in JSON format. However, many government portals and scientific institutions provide their open data directly as text files, such as CSVs (Comma-Separated Values).
The requests module does not care what type of file it is downloading; it simply fetches the raw text from the server.
Let us look at the MeteoSwiss Open Government Data (OGD) portal. They provide historical climate data for stations all across Switzerland.
We want to download the monthly aggregations for the weather station at Kloten (Zurich Airport, station code KLO). The dataset contains dozens of parameters (wind, rain, radiation), but we only want to extract the average monthly temperature (parameter tre200m0) for the year 1953.
Because we have not learned how to use advanced data libraries like pandas yet, we will fetch the data and use basic Python string methods to filter it.
import requests

# 1. Define the URL for the Kloten (KLO) monthly CSV file
# Notice the 'm' at the end of the filename for 'monthly'
csv_url = "https://data.geo.admin.ch/ch.meteoschweiz.ogd-smn/klo/ogd-smn_klo_m.csv"

# 2. Fetch the data
response = requests.get(csv_url)

if response.status_code == 200:
    print("Download successful!\n")

    # 3. Extract raw text (do NOT use .json() here)
    csv_text = response.text

    # 4. Split the massive text block into a list of individual lines
    lines = csv_text.splitlines()

    # 5. Loop through all lines and filter for the year 1953
    print("Average Monthly Temperatures in Kloten (1953):")
    print("-" * 50)
    for line in lines:
        if "1953" in line:
            # MeteoSwiss separates columns with a semicolon (;)
            # Let's split the line into a list of values
            columns = line.split(";")

            # The date is the 2nd column (index 1)
            date = columns[1]
            # The average temperature is the 3rd column (index 2)
            temp = columns[2]

            print(f"{date}: {temp}°C")

else:
    print(f"Failed to fetch data. Status code: {response.status_code}")
If you run this code, you will see exactly 12 lines of data (one for each month of 1953).
While we can use basic string tools like .splitlines() and .split(";") to read a CSV, doing complex data analysis this way is tedious. Later on, you will learn how to use the pandas library to turn these raw CSV strings into powerful, analyzable data tables!
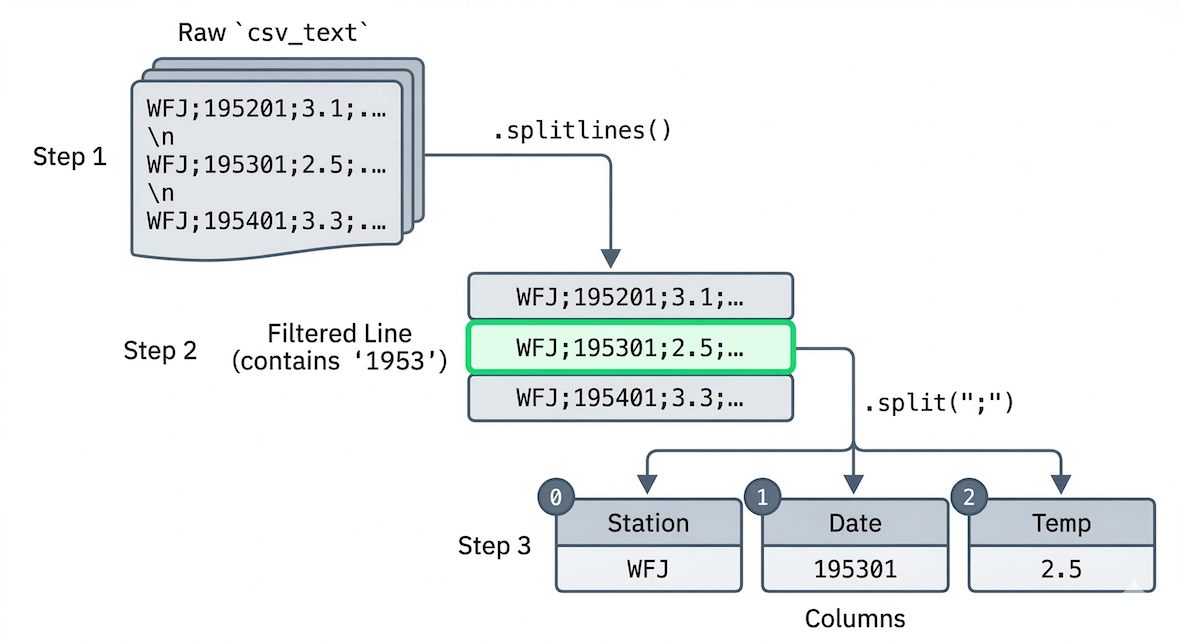
Visualizing the CSV processing logic: The raw text file is split into a list of lines, and then specific data lines are filtered and split again by semicolons into distinct data columns.
6. API rate limiting
Computers are fast. It is very easy to write a loop that sends thousands of queries per second to check the weather in every city globally. Servers cannot handle that much traffic from a single user, so API providers enforce rate limiting.
If you send too many requests too fast, the server will reject them and return an error code (often HTTP 429 “Too Many Requests”).

Analogy for Rate Limiting: An API is like a turnstile that only allows one request per second. Sending thousands of queries simultaneously causes congestion, leading to rejection by the server.
The time module
To prevent your code from moving too fast and getting blocked, you can use the time module from the Python Standard Library. The time.sleep() function forces your code to pause for a specified number of seconds before continuing.
import time

for x in range(3):
    print(f"Sending request {x}...")
    # Pause for 1 second to respect rate limits
    time.sleep(1)
By adding time.sleep() inside your data-fetching loops, you ensure your program plays nicely with the API provider’s rules.
7. Exercises
Practice fetching data and handling rate limits with these exercises.
Exercise 1: Finding the windiest megacity
We want to find out which of the world’s 10 most populated cities is currently experiencing the strongest winds. We can do this by looping through a dictionary of cities, calling the Open-Meteo API for each one, and extracting the wind speed.
Since we are sending 10 requests in a row, we must respect the server’s rate limits by pausing between each request.
Review the code block in Section 4 above to see how the API is called.
Below, we have provided a dictionary containing the names and coordinates of the 10 most populated cities.
Write a
forloop that iterates through themegacitiesdictionary using.items().Inside the loop, create a new
parametersdictionary using the latitude and longitude of the current city. Set"current_weather": "true".Send the
requests.get()command and parse the JSON response.Extract the
windspeedvalue from thecurrent_weatherdictionary and print it alongside the city name.Add
time.sleep(0.5)at the very end of your loop to pause for half a second before the next city is processed.
import requests
import time

api_url = "https://api.open-meteo.com/v1/forecast"

# City name as the key, a tuple of (latitude, longitude) as the value
megacities = {
    "Tokyo": (35.687, 139.7495),
    "Jakarta": (-6.175, 106.8275),
    "Delhi": (28.61, 77.23),
    "Guangzhou": (23.13, 113.26),
    "Mumbai": (19.0761, 72.8775),
    "Manila": (14.5958, 120.9772),
    "Shanghai": (31.2286, 121.4747),
    "Sao Paulo": (-23.5504, -46.6339),
    "Seoul": (37.5667, 126.9833),
    "Mexico City": (19.4333, -99.1333),
}

# Your loop goes here
Sample solution
import requests
import time

api_url = "https://api.open-meteo.com/v1/forecast"

megacities = {
    "Tokyo": (35.687, 139.7495),
    "Jakarta": (-6.175, 106.8275),
    "Delhi": (28.61, 77.23),
    "Guangzhou": (23.13, 113.26),
    "Mumbai": (19.0761, 72.8775),
    "Manila": (14.5958, 120.9772),
    "Shanghai": (31.2286, 121.4747),
    "Sao Paulo": (-23.5504, -46.6339),
    "Seoul": (37.5667, 126.9833),
    "Mexico City": (19.4333, -99.1333)
}

for city_name, coords in megacities.items():

    # 1. Build the parameters for this specific city
    parameters = {
        "latitude": coords[0],
        "longitude": coords[1],
        "current_weather": "true"
    }

    # 2. Make the request
    response = requests.get(api_url, params=parameters)

    if response.status_code == 200:
        data = response.json()

        # 3. Extract the wind speed
        wind_speed = data["current_weather"]["windspeed"]

        # 4. Print the result
        print(f"{city_name}: {wind_speed} km/h")
    else:
        print(f"Failed to fetch data for {city_name}")

    # 5. Respect the rate limit
    time.sleep(0.5)
Key idea:
Combining loops, dictionaries, and time.sleep() allows you to automate repetitive spatial queries without overwhelming external servers.
Exercise 2: Climate change at the Weissfluhjoch
Let us practice fetching CSV data from MeteoSwiss. This time, we want to look at the high-alpine station at Weissfluhjoch above Davos (station code WFJ).
Instead of looking at monthly data for a single year, we want to look at the yearly average temperatures since 1981 to see if we can spot a warming trend.
MeteoSwiss provides yearly aggregations in a separate file ending in _y.csv instead of _m.csv.
Create a variable
csv_urlpointing to the yearly CSV file for Weissfluhjoch (wfj). (Hint: Look at the URL structure in Section 5 and changeklotowfj, and_m.csvto_y.csv).Make a
requests.get()call to this URL.Extract the raw text using
response.text.Break the text into a list of lines using
.splitlines().Write a
forloop to iterate through the list of lines.Inside the loop, check if the string
"WFJ"is in the line (to skip the header and only process data rows).If it is a data row, split the line using
.split(";").Extract the year (index
1) and the average temperature (index2), and print them.
# Write your code here
Sample solution
import requests

# 1. Update the URL for Weissfluhjoch (wfj) and yearly data (_y)
csv_url = "https://data.geo.admin.ch/ch.meteoschweiz.ogd-smn/wfj/ogd-smn_wfj_y.csv"

# 2. Fetch the data
response = requests.get(csv_url)

if response.status_code == 200:

    # 3 & 4. Extract and split the text
    csv_text = response.text
    lines = csv_text.splitlines()

    print("Weissfluhjoch Annual Average Temperatures:")
    print("-" * 50)

    # 5. Loop through the lines
    for line in lines:

        # 6. Skip the header row
        if "WFJ" in line:

            # 7. Split the row into columns
            columns = line.split(";")

            # 8. Extract the year and temperature
            year = columns[1]
            temp = columns[2]

            print(f"{year}: {temp}°C")

else:
    print("Failed to fetch the CSV file.")
Key idea:
API endpoints are often highly structured. By understanding how the URL is built (.../station_code/ogd-smn_station_code_granularity.csv), you can easily swap out parameters to fetch different datasets without needing a complex search interface.
8. Summary
In this section, you learned how to break out of your local machine and fetch dynamic spatial data from the web.
Key ideas
APIs allow your code to talk to external servers automatically.
The
requestsmodule makes sending queries and receiving data simple.Data on the web is heavily exchanged using JSON.
You extract data from a response by parsing the JSON into a standard Python dictionary using
.json().Rate limiting is critical. You must use
time.sleep()to slow down your loops and respect the provider’s server limits.
What comes next?
You now know how to fetch live data using exact latitude and longitude. But what if you only have a list of street addresses, city names, or landmarks?
In the next section, Geocoding, we will use Web APIs to bridge the gap between human language and computer geometry. You will learn how to automatically translate everyday text into exact, mappable coordinates, and vice versa.