1. Introduction
JupyterLab (documentation) is an alternative browser-based working environment in case you prefer it over VS Code. It provides a simple interface where thinking, coding, and documentation come together. If you are comfortable with VS Code you can skip this chapter.
In spatial data science, work is rarely linear. You load data, inspect it, try something, visualise the result, adjust your approach, and document what you learned. JupyterLab is designed for exactly this kind of exploratory and iterative work.
A Jupyter notebook combines executable code, text explanations, figures, and maps in one place. This makes it easier to:
understand what your code does
explain why you made certain choices
revisit and reproduce your analysis later
This is especially important when working with spatial data, where data sources, projections, and processing steps can strongly influence results. By keeping code and explanation together, notebooks support reproducibility, transparency, and a clear analysis narrative.
In this chapter, you will learn how to use JupyterLab as a structured workspace for spatial data science. The focus is not on learning every feature, but on developing good working habits that you will use throughout the course and beyond.
2. Learning Objectives
After working through this chapter, you should be able to:
explain how JupyterLab fits into a spatial data science workflow
navigate the JupyterLab interface and manage notebooks and files
create and run notebooks that combine code, text, and visual output in a reproducible way
These objectives focus on using JupyterLab as a practical working environment for exploration, documentation, and analysis. You will use these skills throughout the course when developing and refining your own spatial data workflows.
3. Getting Started
Before using JupyterLab, it is important to think about where it is installed and which environment it belongs to. In this course, JupyterLab is already part of your sds210 environment. This keeps your setup clean, avoids version conflicts, and makes your work easier to reproduce.
Recommended setup strategy
JupyterLab should not be installed system-wide in your base environment. Instead, you should install it inside a dedicated Conda environment, if you start a new project.
The basic idea is simple:
one environment per project
the environment must be activated before starting JupyterLab
all packages used in a notebook come from the active environment
If this is new to you, revisit the Conda chapter before continuing.
Installing JupyterLab
The recommended way to install JupyterLab is with Conda, as it handles geospatial dependencies reliably. Install JupyterLab into an active Conda environment using the conda-forge channel.
conda install -c conda-forge jupyterlabIf you are working in a pip-based environment, you can install JupyterLab with:
pip install jupyterlabOnly use one package manager per environment when possible.
Verifying the installation
After installation, always check that JupyterLab is available in the active environment.
Run the following command in your Terminal:
jupyter lab --versionYou should see a version number printed in the terminal. If you get an error, check the following first:
Is the correct environment activated?
Was JupyterLab installed into that environment?
Are you accidentally using a different Python installation?
Taking a minute to verify your setup now will save you a lot of time later.
4. Launching JupyterLab
Before working with notebooks, it helps to understand what actually happens when you start JupyterLab. This section focuses on building a mental model of how JupyterLab works, rather than on clicking through menus.
Run jupyter lab
When you run jupyter lab, you are not opening a normal desktop application. Instead, JupyterLab starts a local Jupyter server on your computer.
Here is what happens in the background:
a local server starts and runs in your terminal
your web browser acts as the user interface
the address usually points to
localhost, which means your own machinethe terminal must stay open because it is running the server
If you close the terminal, the server stops and JupyterLab shuts down. Understanding this connection between terminal, server, browser, and notebook kernels helps explain many common issues students run into later.
Interactive Explorer: JupyterLab Launch Circuit.
Click through the launch steps to activate an environment, start the Jupyter server, open JupyterLab in the browser, select a kernel, and run a notebook cell. The animation shows how the terminal, server, browser interface, notebook, and Python kernel work together when you run jupyter lab. For improved visibility of the explorer, follow this link.
The JupyterLab interface
The JupyterLab interface is designed as a flexible workspace. A useful way to remember its structure is the following mental model:
Command – Canvas – Context – Status
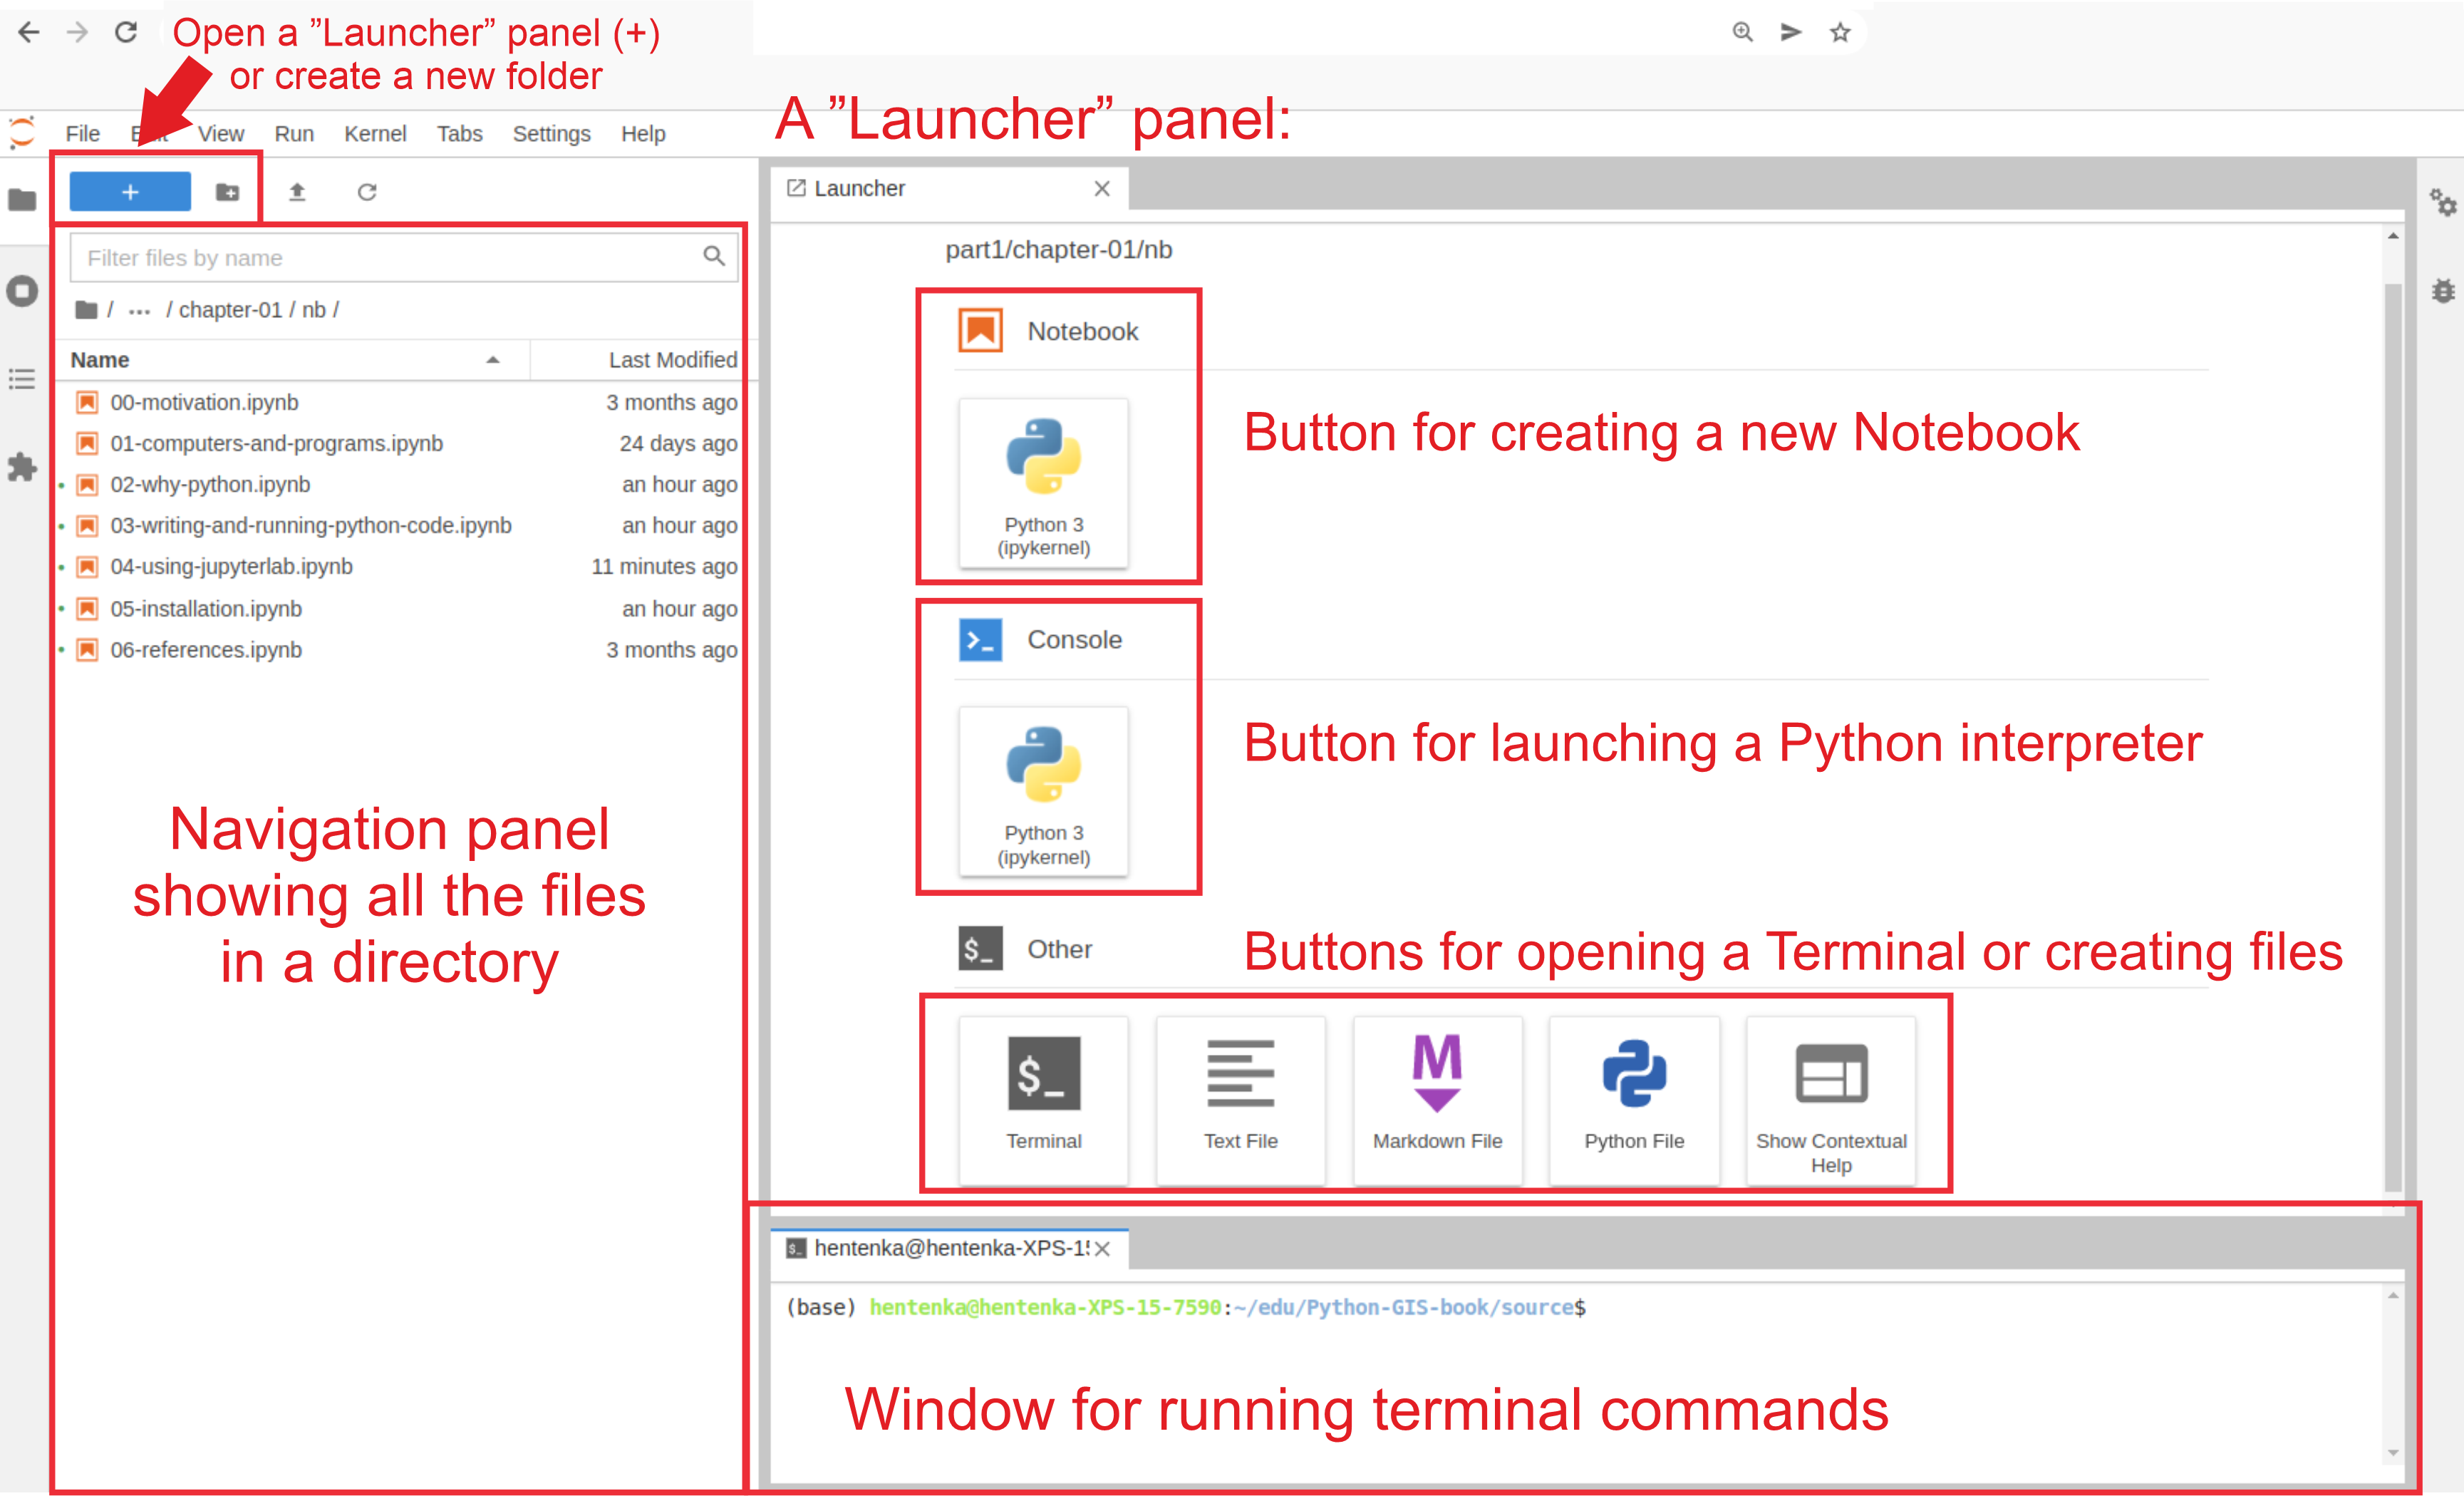
The main interface components of the JupyterLab IDE (source: python-gis-book).
Each part has a clear role:
Left Sidebar
This is your project and control area. You browse files, manage running notebooks, and access additional tools.Main Area
This is the work canvas. Notebooks, terminals, and files open here and can be arranged side by side.Menu Bar
This contains global actions such as saving files, running cells, changing kernels, and adjusting the layout.Status Bar
This provides feedback and state information, such as whether the kernel is busy or idle.
Keeping this structure in mind makes it easier to navigate JupyterLab and transfer these skills to other development environments later in the course.
5. Notebooks as Scientific Documents
In this course, notebooks are not temporary scratchpads. They are scientific documents that combine code, explanation, and results. A good notebook tells the story of your analysis in a way that others and your future self can understand.
Creating a notebook
When JupyterLab starts, you will see the Launcher. This is the entry point for creating new files.
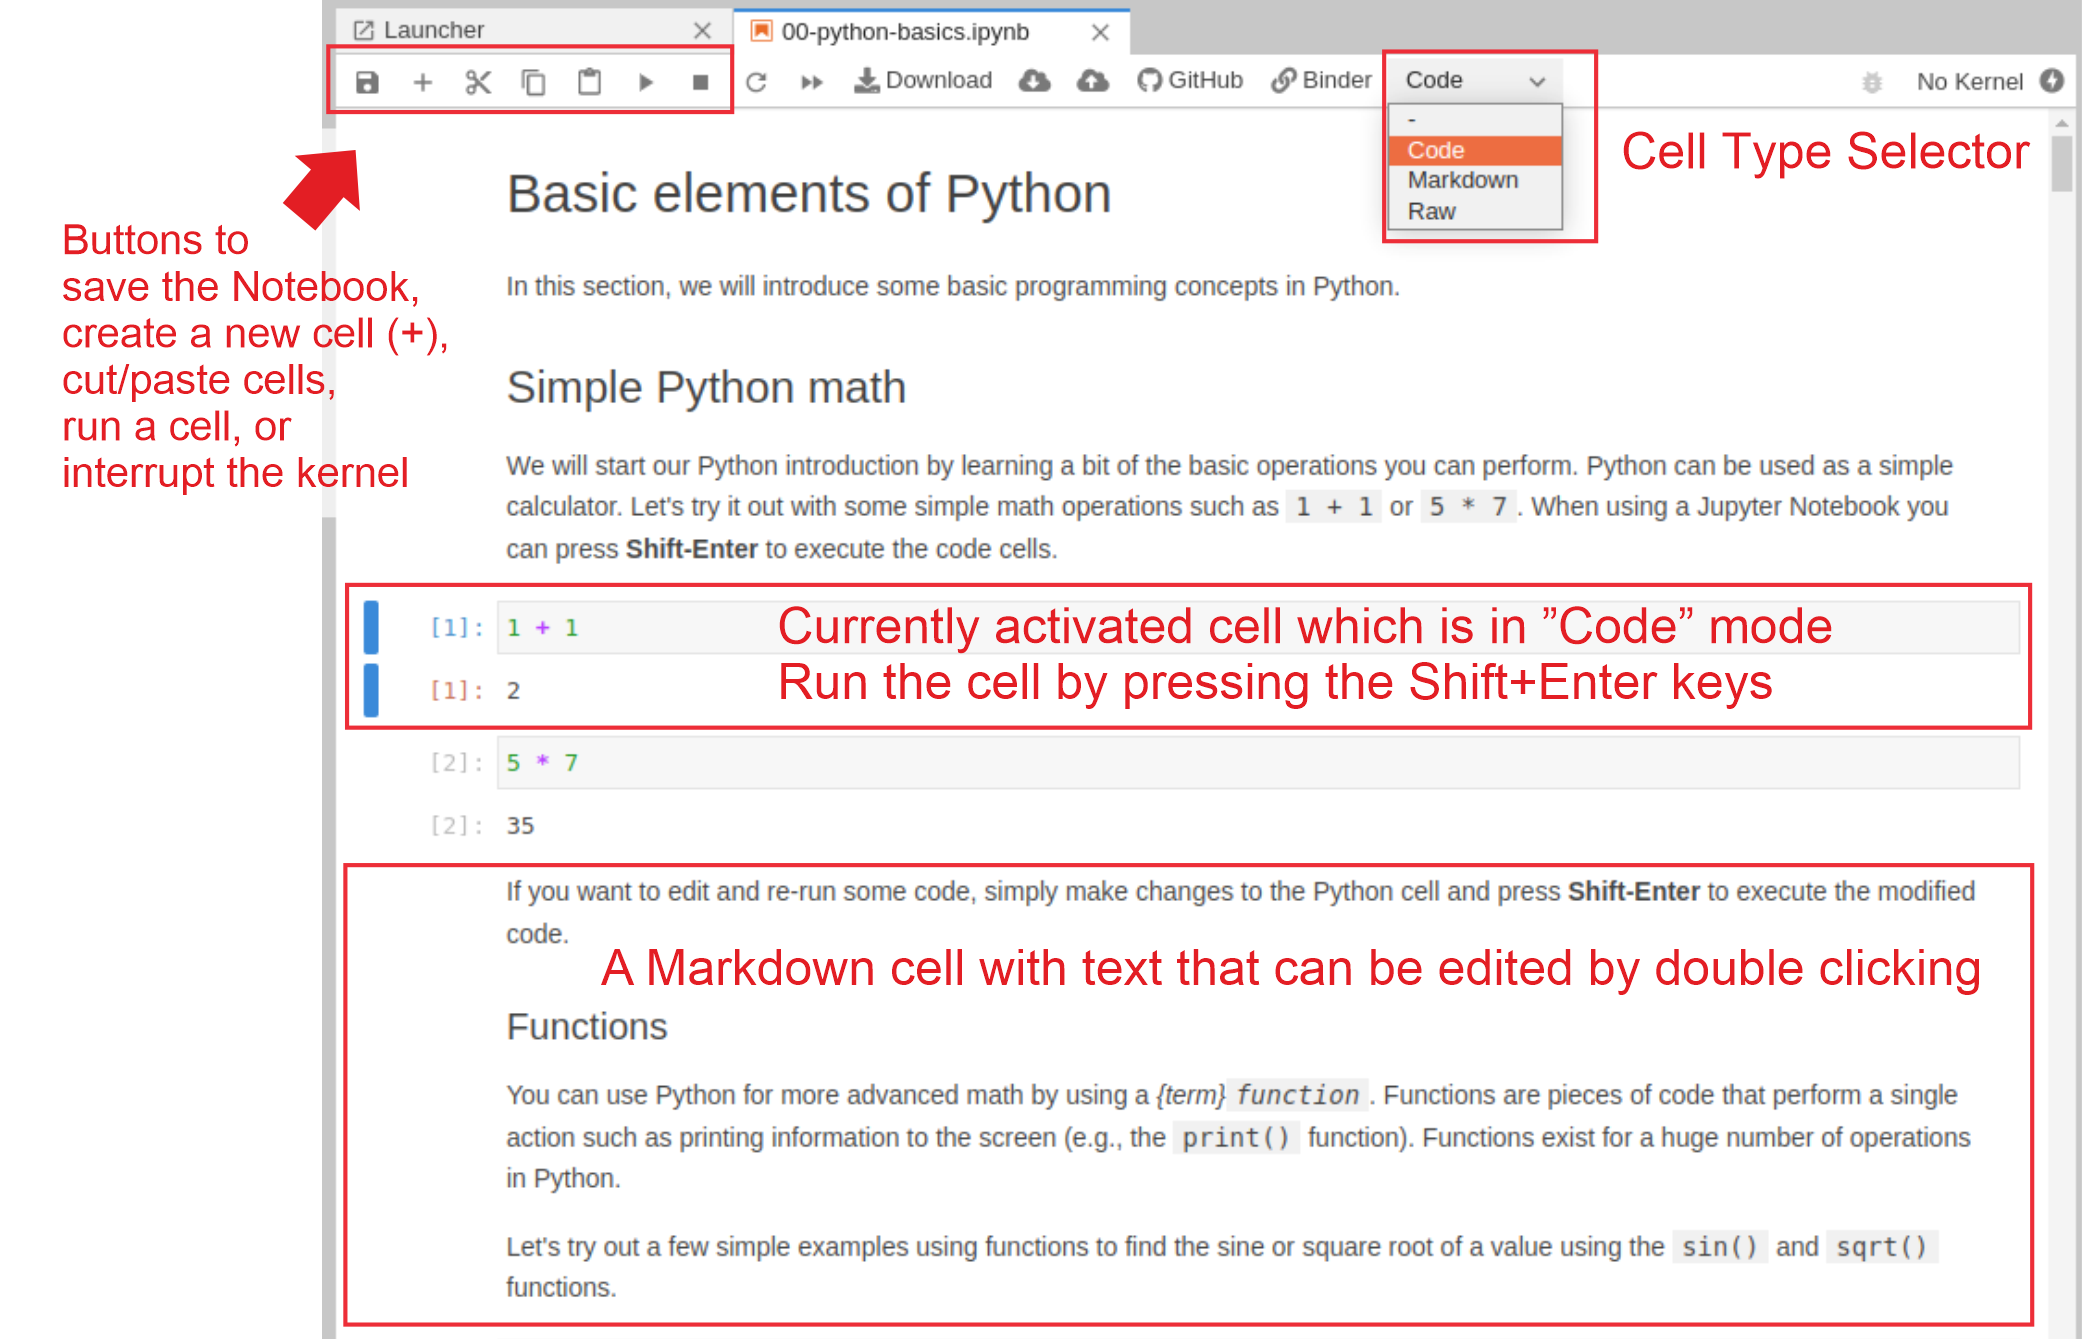
The basic components of a Jupyter notebook opened in JupyterLab (source: python-gis-book).
To create a notebook:
choose a Python kernel that belongs to your active environment
create the notebook from the Launcher
give the file a clear and meaningful name
Good naming matters. A notebook called analysis.ipynb tells you very little. A name like snow_cover_exploration_v1.ipynb makes the purpose clear even months later.
Cells, execution, and state
Notebooks run code in code cells, and these cells are executed sequentially. This means the order in which you run cells matters.
A common source of confusion is hidden state. Variables can exist in memory even if the cell that created them is no longer visible or was changed later.
To avoid problems:
run cells from top to bottom
use Restart Kernel and Run All regularly
check that your notebook works from a clean start
This habit is essential for reproducibility and for submitting reliable work.
Markdown cells and explanation
A notebook should not only contain code. Use Markdown cells to explain what you are doing, why you are doing it, and what the results mean.
Good Markdown cells help you:
introduce the research question or task
document data sources and assumptions
explain important processing steps
interpret figures, maps, and tables
make the notebook easier to understand later
Think of Markdown cells as the narrative that connects your code into a coherent analysis.
The geospatial output
To see how notebooks behave, start with a minimal geospatial example. The goal here is not to understand the mapping library, but to observe the notebook workflow.
You typically go through three steps:
When you run a cell that produces visual output, JupyterLab automatically renders it below the cell. This tight link between code and output is what makes notebooks so powerful for exploration and communication in spatial data science.
6. Productivity Fundamentals
Working efficiently in JupyterLab is less about speed and more about reducing cognitive load. Using the keyboard helps you stay focused on your analysis instead of constantly switching between mouse and menus.
This section introduces only the essential concepts and shortcuts you need to work fluently. You do not need to memorise everything at once.
Notebook modes
Jupyter notebooks operate in two distinct modes. Many beginner mistakes happen because these modes are confused.
Edit mode
used to write and modify code or text
a cursor is visible inside the cell
the cell border indicates active editing
Command mode
used to navigate and manage cells
no text cursor is visible
the whole cell is selected as an object
Always be aware of which mode you are in. If something does not behave as expected, mode confusion is often the reason.
Core shortcuts
You only need a small set of shortcuts to work productively. These are the ones you will use constantly:
Shift + Enter to run a cell and move to the next one
Ctrl + Enter to run a cell and stay in place
Alt (⌥) + Enter to run a cell and create a new one below
Esc to switch to command mode
Enter to switch to edit mode
A to insert a cell above
B to insert a cell below
M to change a cell to Markdown
Y to change a cell to code
DD to delete a cell
Z to undo a cell deletion
Most keyboard shortcuts depend on the current notebook mode. Shortcuts that act on the structure of the notebook, such as creating, deleting, or moving cells, only work in command mode. If they do nothing, you are usually still in edit mode.
Shortcuts that run cells, such as Shift + Enter or Ctrl + Enter, work in both modes. Shortcuts that edit text only work in edit mode. Mastering these shortcuts already gives you most of the productivity benefits.
Editing vs. structuring
A useful way to think about notebook work is to separate two activities:
editing content inside a cell, which happens in edit mode
structuring the analysis by adding, moving, or reorganising cells, which happens in command mode
Being aware of this distinction helps you work more deliberately. You edit when you think about code and text. You structure when you think about the story your analysis is telling.
7. Working Without a Local Setup
Not everyone can or wants to install software locally right away. For this reason, most parts of the course material can also be run using Binder and Colab.
Both services allow you to work with notebooks directly in your browser, without setting up a local Python environment.
What Binder and Colab are
Binder starts a temporary JupyterLab environment that is linked to a course repository.
Colab provides hosted Jupyter notebooks that run on Google infrastructure.
Both options:
run in the browser
require no local installation
are suitable for learning and experimentation
When to use them
Binder and Colab are useful when:
you want to quickly explore course notebooks
you are working on a shared or restricted computer
your local setup is not ready yet
They help lower entry barriers and ensure everyone can participate.
Limitations to keep in mind
Both Binder and Colab have limitations:
startup can take time
environments are temporary
file persistence is limited or requires extra steps
Because of this, they are best used for short tasks and exploration.
Binder and Colab are for learning, not for long-term projects.
8. Exercises
These exercises help you practise using JupyterLab as a working environment for spatial data science. The goal is not to learn every feature, but to build confidence with the core workflows you will use throughout the course.
Work through the exercises at your own pace. If something breaks, that is part of the learning process.
Exercise 1: Setting Up Your JupyterLab Environment
Objective
Set up and verify a working JupyterLab environment for spatial data analysis.
What you practise
working with Conda environments
installing packages
launching and testing JupyterLab
Tasks
Create and activate a dedicated environment:
conda create -n geolab python=3.12
conda activate geolab
Install JupyterLab and basic geospatial packages:
conda install -c conda-forge jupyterlab geopandas matplotlib ipyleafletLaunch JupyterLab:
jupyter labExplore the interface:
locate the file browser, main area, menu bar, and status bar
open multiple tabs and arrange them side by side
Verify your setup:
create a new notebook
run the following imports in a code cell:
import geopandas as gpd
import matplotlib.pyplot as plt
import ipyleaflet
print("Geospatial environment ready")
What to verify
JupyterLab starts without errors.
The notebook runs from top to bottom.
All imports work successfully.
Exercise 2: Keyboard Shortcuts and Efficient Workflow
Objective
Develop fluency with keyboard-driven notebook work.
What you practise
switching between edit and command mode
running and structuring cells
reducing reliance on the mouse
Tasks
Practise essential shortcuts:
run cells with Shift + Enter, Ctrl + Enter, and Alt + Enter
switch modes using Esc and Enter
create cells using A and B
delete and recover cells using DD and Z
Create a practice notebook using only the keyboard:
create at least eight cells
mix code and Markdown
change cell types using M and Y
navigate using arrow keys in command mode
Practise editing and restructuring:
copy and paste cells
rearrange the order of cells
merge or split cells if needed
Check notebook state:
restart the kernel
run all cells from top to bottom
confirm that the notebook still works
What to verify
You can build and restructure a notebook without using the mouse.
The notebook runs cleanly after a kernel restart.
Optional Challenge: Workflow Efficiency
Objective
Improve speed and confidence when working in notebooks.
What you practise
combining shortcuts into a smooth workflow
separating editing from structuring
Tasks
create a new notebook
add ten cells with alternating code and Markdown
use only the keyboard
restart the kernel and run all cells
What to verify
The notebook structure is clear.
All cells run without errors.
You feel more comfortable navigating and controlling JupyterLab.
These exercises prepare you to use JupyterLab naturally in later labs and projects, where the focus will be on spatial data analysis, not on tool mechanics.