In this course, you will complete one individual programming project. Each topic is built around open data and a real-world spatial question. The goal is not to reproduce a fixed “correct” answer, but to design and implement your own analytical workflow using the concepts and tools developed during the semester.
All four topics allow you to practice the core elements of spatial data science: data access, data cleaning, structured code design, spatial analysis, visualization, and reproducibility. They differ mainly in their thematic focus, their data sources, and the kinds of analytical decisions you will need to make.
Project 1: ZüriWieNeu
This project focuses on analyzing reported urban issues in the city of Zurich. You will combine open data from the Züri wie neu reporting platform with spatial boundaries of Zurich’s neighborhoods (Quartiere).
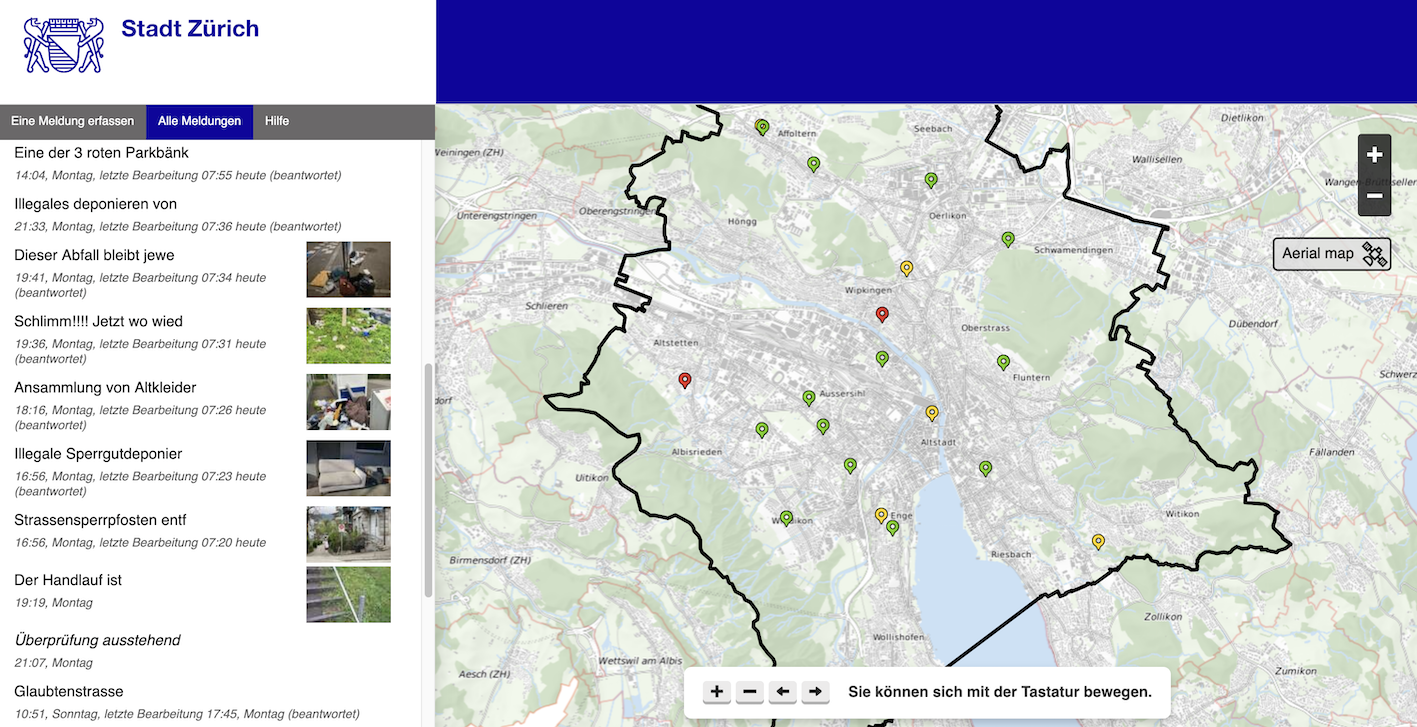
Reported infrastructure issues in Zurich via the Züri wie neu platform.
Core idea
Your primary goal is to build a robust data model that represents this urban information meaningfully. You will read the raw data, organize it into suitable Python structures (like DataFrames or custom classes), and use spatial logic to explore patterns in the reported problems across the city.
This project is especially well-suited for students who want to practice data engineering. You will need to decide which attributes actually matter, how to store individual reports efficiently, and how to logically connect point data (reports) to polygon data (neighborhoods).
What you will work with
In this project, you will:
Read and sanitize data from local files.
Structure raw records into suitable Python objects or Pandas collections.
Perform spatial joins to connect individual reports to neighborhood-level polygons.
Answer specific spatial questions about urban patterns in Zurich.
Suggested task
Your task is to create a workflow that reads, structures, and analyses the ZüriWieNeu data in a clear and reproducible way. Once your data are prepared and organised, you must formulate and answer at least four interesting questions using your code.
Examples of project questions include:
Which neighbourhoods receive the highest number of reports?
Which categories of problems are most common across the city?
Are certain types of issues concentrated in particular neighbourhoods?
How does the number of reports vary over time or between neighbourhoods?
Are highly frustrated reports spatially clustered across Zürich?
Project 2: Wildfire Mapping
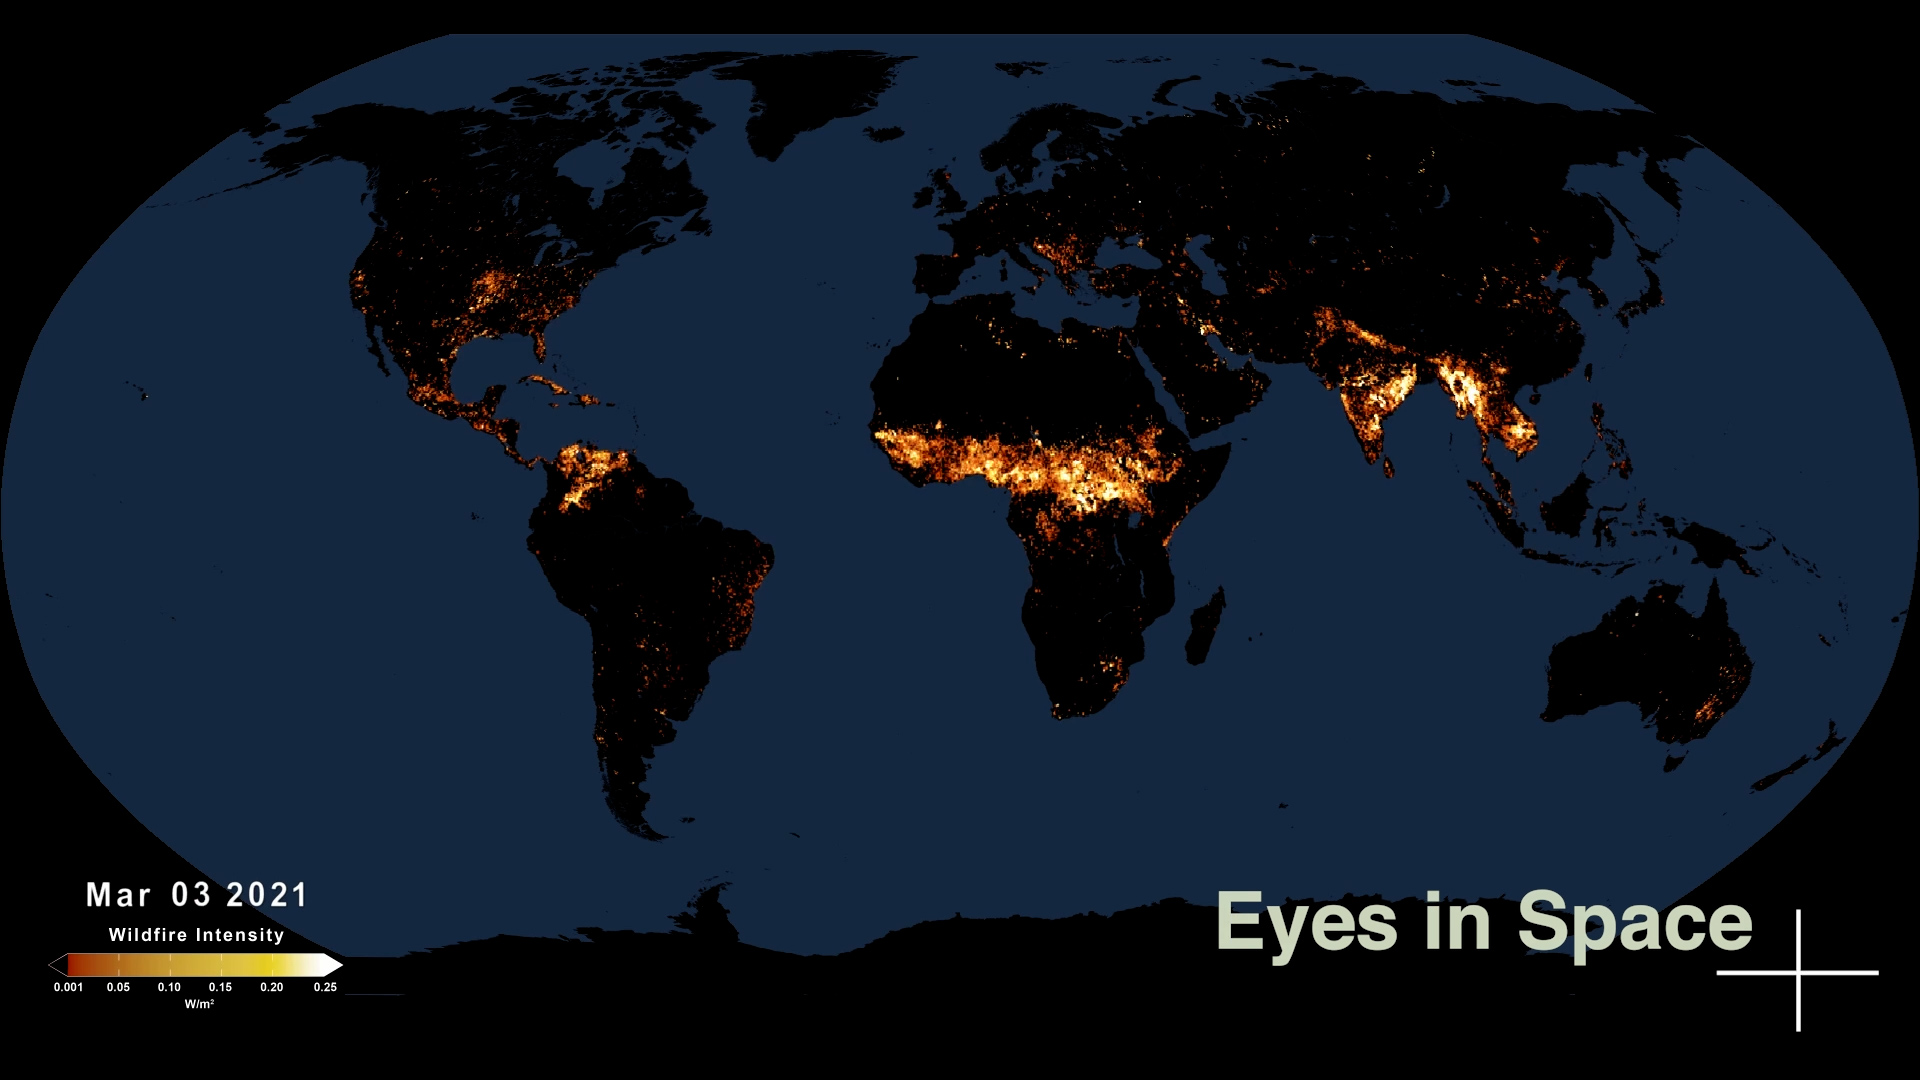
This project focuses on processing live or recent event data and presenting it through interactive web mapping. It builds on the classic workflow of reading dynamic data, analyzing specific attributes, and visualizing the results geographically.
Core idea
Your main aim is to design an automated pipeline that reads wildfire data, extracts the most useful information, performs a targeted analysis, and presents the results clearly on an interactive map.
You can source your data from static files you download locally, or you can elevate the project by querying a live web API. Using an API makes the final map feel highly dynamic and relevant.
What you will work with
In this project, you will:
Access wildfire data from a static file or a live web service.
Inspect, clean, and format the attributes (e.g., dates, confidence, intensity).
Analyze specific properties of the wildfire events.
Use tools like Folium or GeoPandas
.explore()to visualize the locations and metadata on an interactive web map.
Suggested task
Your task is to find a suitable wildfire dataset and build a Python system that automatically reads, analyzes, and maps the data. You must think carefully about which properties are the most informative to the user and how they should be represented visually (e.g., using varying marker sizes or colors). Furthermore, your workflow should include at least one spatial analysis, investigating the distribution of fires across biomes, counties, or any other suitable feature at your chosen mapping scale.
Examples of project questions include:
Where are the most recent or most severe wildfires located?
How do the events differ in physical size, thermal intensity, or duration?
Which biomes are most affected by fires?
How can interactive elements (like pop-ups and tooltips) improve the map’s readability?
Project 3: Change Detection
This project focuses on identifying environmental damage using advanced change detection techniques. You will utilize both AlphaEarth embeddings and Sentinel-2 satellite composites to compare spatial patterns before and after a major catastrophic event. The suggested case study is the devastating Hawaii wildfires of 2023.
Core idea
Your main aim is to compare satellite data from two distinct points in time to identify exactly where the strongest physical changes occurred on the ground.
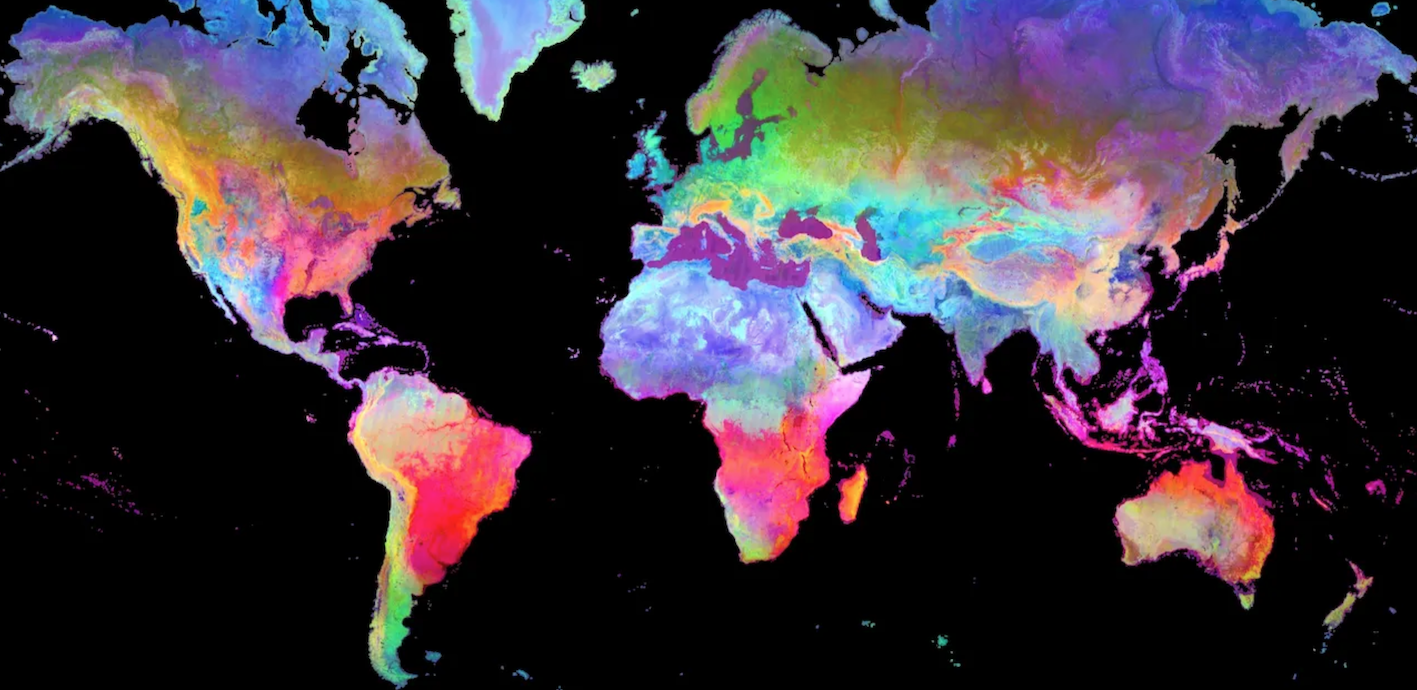
Instead of relying solely on traditional spectral bands or simple image differencing, this project challenges you to explore the use of AI-generated embeddings. These embeddings provide an abstract, feature-rich representation of the image content. This makes the project methodologically fascinating: you are not just asking what changed, but exploring how advanced spatial change can be mathematically represented and detected.
What you will work with
In this project, you will:
Access pre-event and post-event spatial data.
Work simultaneously with AlphaEarth embedding layers and traditional Sentinel-2 spectral bands.
Structurally compare two time periods to detect anomalies.
Identify, visualize, and interpret the areas that experienced the most severe change.
Depending on your specific approach, this workflow may include calculating similarity measures, generating spectral indices, and deriving change metrics to distinguish burned areas from naturally changed (but unburned) areas.
Suggested task
Your task is to develop a workflow that compares the “before” and “after” data for the Hawaii fires and accurately highlights the areas of meaningful spatial destruction. Your primary goal is to ensure your workflow remains interpretable and reproducible, even though you are utilizing advanced, abstract data representations.
Examples of project questions include:
Which specific areas changed the most drastically after the fire?
How can complex, embedding-based change detection be effectively summarized and visualized on a 2D map?
How does the accuracy of the embedding approach compare to a traditional spectral image comparison?
Can you distinguish burned areas from other types of change by combining a spectral index with the embedding-based change detection?
Project 4: Urban Heat
This project focuses on tracking long-term environmental change in Zurich using satellite-derived indicators. You will analyze urban heat patterns over time using Landsat-based Land Surface Temperature (LST), and compare it alongside vegetation indicators like the Normalized Difference Vegetation Index (NDVI).
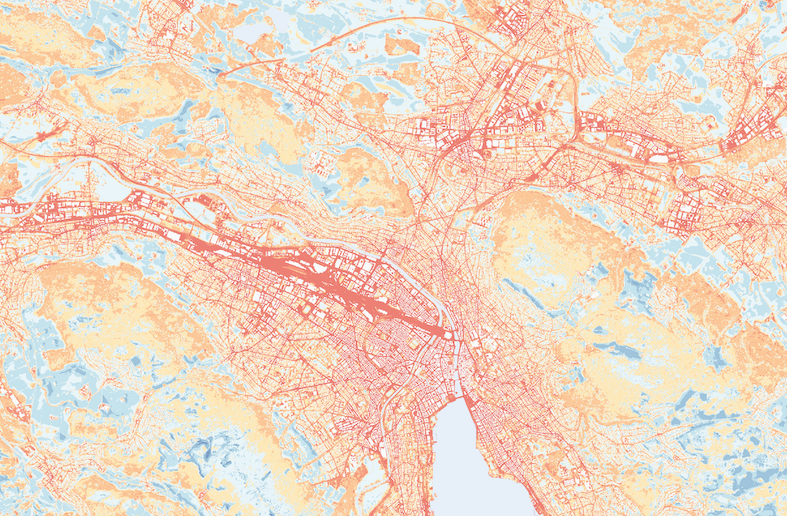
Klimamodell 2024: Klimaanalysekarte Nacht - Zukunftsszenario
Core idea
Your main aim is to explore how urban surface conditions in Zurich have evolved over time and how localized heat patterns physically correlate to vegetation density. You will work over a long observation period, tri-annual multispectral data from 1985 to 2024, and you aim to develop a coherent workflow for comparing these different environmental indicators.
This topic is very analytical. It requires you to think critically about long-term trends, spatial patterns, and the statistical relationships between environmental variables (e.g. LST vs. NDVI).
What you will work with
In this project, you will:
Access and analyze Landsat-based time series data.
Compare Land Surface Temperature (LST) and vegetation indicies.
Calculate and compare changes in LST and vegetation over time.
Summarize and visualize the climatic trends for Zurich.
This workflow will involve applying spectral indicies, generating time-series charts, and analysing temporal trends.
Suggested task
Your task is to analyze long-term urban heat dynamics within a clearly defined boundary. You must build a workflow that extracts meaningful statistical information from the time series and presents it in a way that clearly communicates how the urban environment has changed over the decades.
Examples of project questions include:
How drastically has the average land surface temperature changed since the mid-1980s?
Is there a measurable correlation between warmer urban areas and lower vegetation or high build-up signals?
How do spectral indices help us interpret the physical causes of these heat patterns?
Are specific neighborhoods within the city warming faster than others?
Comparing the topics
All four topics are valid, challenging choices, but they cater to slightly different analytical strengths and interests.
Topic | Main focus | Typical strengths |
|---|---|---|
ZüriWieNeu | Urban reports and neighborhood analysis | Data modeling, structured analysis, clear local questions |
Wildfire Mapping | Event data and interactive web maps | APIs, data parsing, cartography, visual communication |
Change Detection | Before/after comparison with embeddings | Experimental analysis, remote sensing, spatial anomaly detection |
Urban Heat | Long-term satellite time series | Trends, statistical indicators, charting, environmental interpretation |
The next section explains how to develop your chosen project, from the initial idea to a functioning, reproducible Python solution.